Gallery
JavaScript Chart TypesClassic Gauge Charts
JSCharting gauge charts can support multiple gauge needles, axis markers and custom gauge sizes to provide ideal dashboard angular gauge visualizations to meet your specific needs.
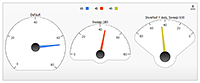
Gauge with two points of varying lengths.
Gauges with different sweep angles.
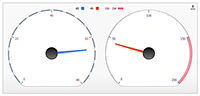
Gauges representing two series with separate axis settings.
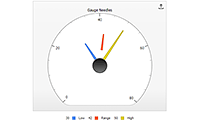
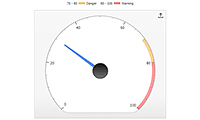
Gauge with axis markers.
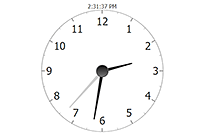
Gauge simulating a real-time clock.