Gallery
JavaScript Chart FeaturesVisual Styling
JSCharting is designed to look great without any tweaking or customization; however, it can also be customized to fit the specific look and feel of your site. Virtually all visual elements can be manipulated with advanced gradients and other effects to ensure your exacting needs are easily met.
Demonstrates styling the y axis including all related elements such as gridlines, tickmarks, alternate fills, and labels.
Styles major and minor tick labels with different formatting.
Applies styling to the chartArea.
Specifies chart box and background visual settings.
Utilizes a predefined template with a chart. A template can be used to define chart appearance for all charts in a website.
Icon browser with search to view and find all available icons.
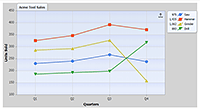
Demonstrates styling chart labels.
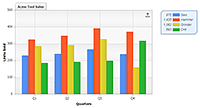
Demonstrates a number of legend box styling options.
Demonstrates styling the reset zoom button.
Applies many styling properties to the title box.
Styles the export toolbar buttons.
Use orientation and offset to position the toolbar.