Gallery
JavaScript Charting TypesFinance Charts
JSCharting provides advanced financial chart support including candlestick, open-high-low-close (OHLC), volume, multiple chart areas and technical indicators. Advanced pan and zoom functionality, including a google finance like navigator interface are also supported
A finance candlestick chart.
A finance candlestick chart with aqua shading.
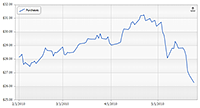
A finance line chart.
A finance chart with OHLC series type.
A finance candlestick chart with annotations.
A finance chart with stochastic indicators over multiple chart areas.
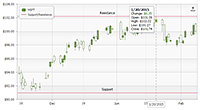
A finance candlestick chart with rounded shading and support/resistance axis markers.
A finance candlestick chart with volume and rounded shading.


