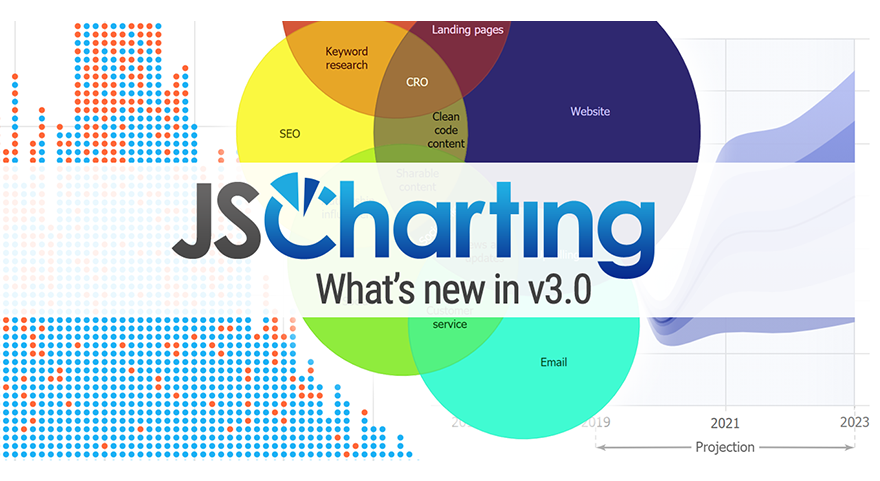
TLDR: For a limited time the JSCharting 8 in 1 bundle is being licensed for whatever you want to pay, with all proceeds being donated to Ryan’s Well Foundation.
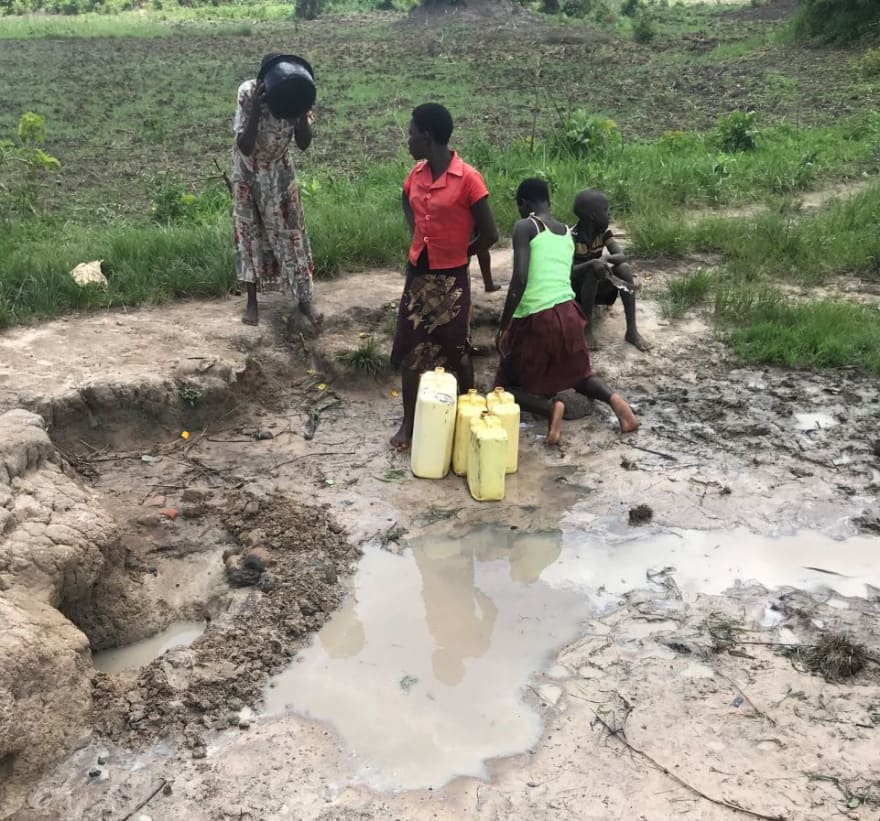
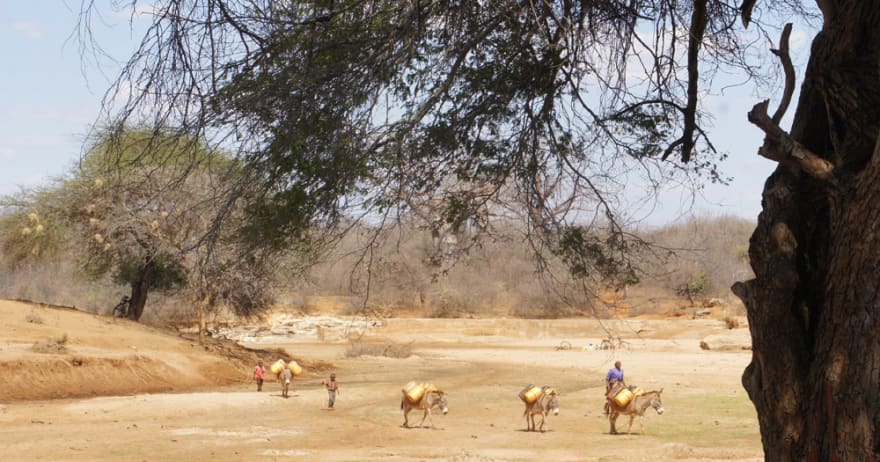
Did you know that over 1 billion people don't have access to safe drinking water and 2.8 billion people lack adequate sanitation? The contaminated surface water below is depended on by a community of over 1000 people.
At JSCharting we believe that all people should have access to safe, clean drinking water. Without accessible water, children and women are less likely to attend school because they need to travel long distances to collect water for their families. These long journeys also put them at risk of assault. The United Nations recognizes access to water and sanitation as a fundamental human right; however, many populations still lack access to basic drinking water:
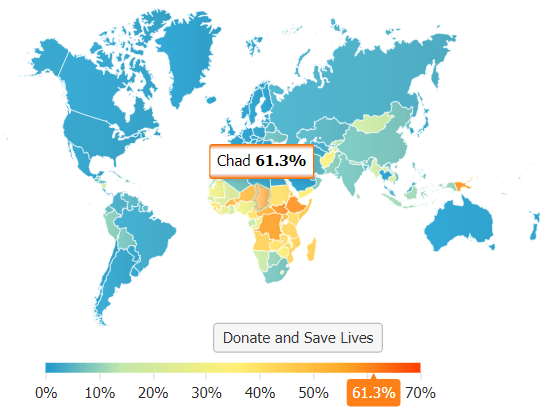
View an interactive JavaScript version of this map.
To help those in need receive this basic human right, JSCharting has partnered with Ryan's Well Foundation and, with your support, we can make a difference.
Purchase a JSCharting 8 in 1 bundle at the price you choose and all proceeds will be used to drill wells, improve sanitation, and fund education.
In addition to donating all future proceeds from the PWYW campaign, JSCharting has also made a $20,000 donation to Ryan's Well Foundation.
When you Pay What You Want for JSCharting today, you will help save lives tomorrow. A heartfelt thanks to the JavaScript developer community for your support and for making a positive difference in the world!