Version 2.7 Released (view complete timeline)
11/16/2018New In JSCharting
JSCharting includes an incredibly extensive suite of 150+ advanced chart types, interactive stock charts and JSMapping all bundled at one low price. The team at JSC is totally committed to making the best visualization tools in the world and constantly innovates based on your feedback. Below you can find a selection of exciting new features powered by developers, for developers. Enjoy!
Getting Started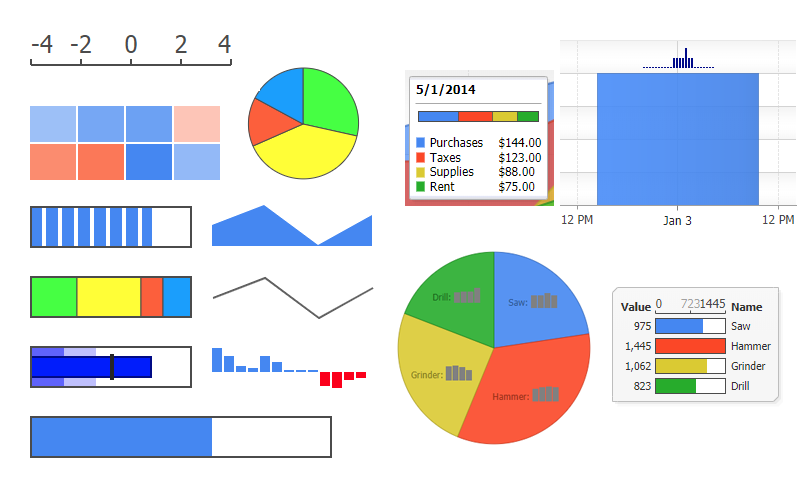
JSCharting labels are incredibly powerful supporting features such as microcharts and the ability to utilize the full icons library. Version 2.7 expands this support enabling the complete label feature set to be used with any div element on a web page. This allows microchart visualizations to be seamlessly embedded into data driven html pages. The built in SVG icons library can also be used, enhancing visual clarity and creating more aesthetically pleasing experiences.
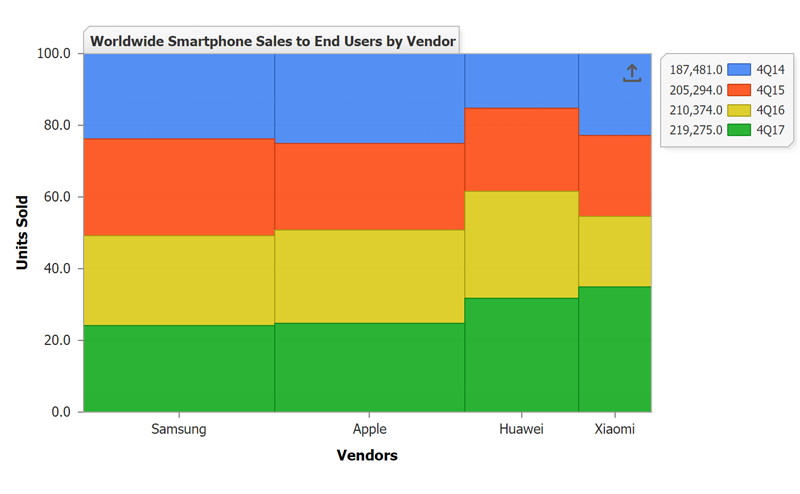
Variwide, marimekko, and mosaic are all names associated with this powerful new chart type added in version 2.7. The variwide chart type is an alias for an x axis stacking mode that works with category x axis scales and column series. Combining this type with y axis full stacked mode results in a Marimekko diagram, also known as mosaic plot.
New slider, file and dropdown scroll support user interface controls have been added in JSCharting 2.7. Sliders can be used to enhance chart interactivity by adjusting data scope visualization in real-time and include both single and dual handle configuration options. The file control allows users to provide custom data files to visualize within the chart.
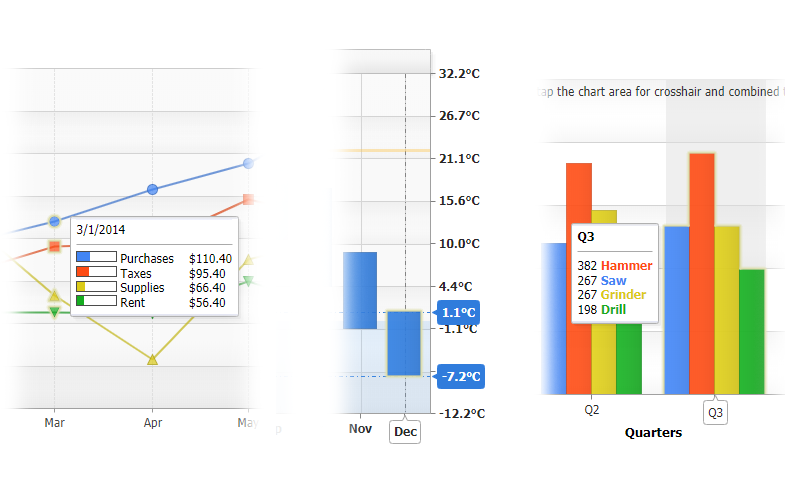
This set of features provides greatly enhances analytic chart interactivity. Combined tooltips can be enabled and customized with calculations and microcharts to display quantitative relationships of groups of points that share x values, while crosshairs provide additional contextual detail displayed directly on the axes themselves. Crosshairs can be customized and used with or without tooltips and provide an alternative method of forcing tooltips to appear by triggering tooltips for any points at a given x axis position.
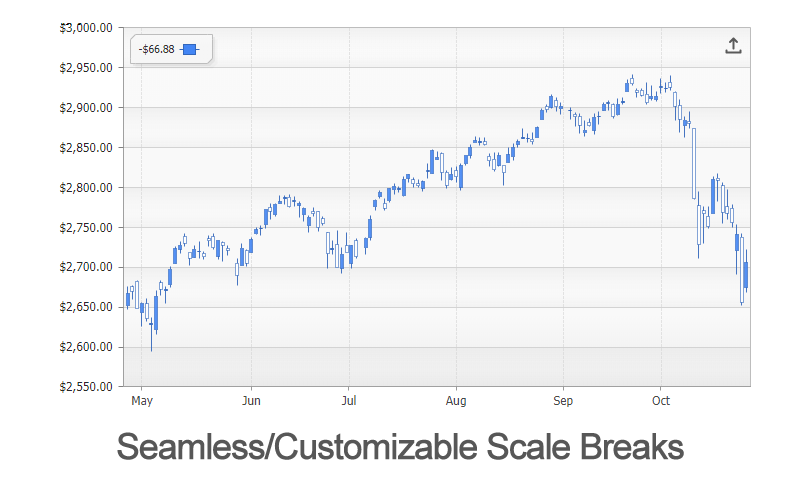
Scale breaks can now be defined with calendar patterns. Some source data, such as finance stock prices, may exclude weekends when markets are closed. It is now easier than ever to simply exclude weekends from the timeline x axis using scale breaks with weekend calendar patterns. Additional scale break styling options were added in version 2.7, including break width which can be specified with a seamless mode that does not mark the scale breaks at all.
Point focus glow styling options have been added which work in conjunction with combined tooltips to highlight relevant data points. In addition, a point '%icon' token can now be used in any point label or tooltip to aid in describing and identifying points. This is useful when multiple points are described in a combined tooltip.
JSCharting labels are incredibly powerful supporting features such as microcharts and the ability to utilize the full icons library. Version 2.7 expands this support enabling the complete label feature set to be used with any div element on a web page. This allows microchart visualizations to be seamlessly embedded into data driven html pages. The built in SVG icons library can also be used, enhancing visual clarity and creating more aesthetically pleasing experiences.
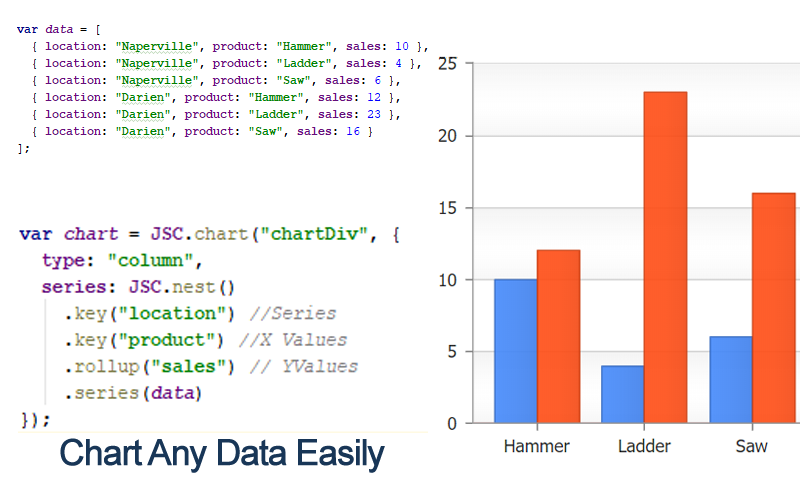
The data nesting utility is a very powerful mechanism that allows processing any arbitrary data set (array of objects) into chart data series and points through a very simple and intuitive api. Complex tasks such as date grouping with calendar patterns can be achieved with little effort. The gallery nesting section demonstrates several data processing scenarios that are implemented with a single FP API call chain, handling very complex data inputs and visualizing them with ease.
Version 2.7 introduces a complete set of utility functions for acquiring data over the wire and converting it to and from more practical JSON formats. In addition, the common alternative TSV (tab) and arbitrary delimiter characters are fully supported.
Additional utility functions such as merge, sum, mean, min, and max have been added to extend the data processing feature set and work seamlessly with data nesting.
JSCharting now provides hosted CDN javascript files to remove barriers to prototyping and evaluation. Experimenting with JSCharting in codepens, or seeing how JSCharting handles your data has never been easier!
New integration samples have been added for popular frameworks including React, Angular, AMD and Vue.js.
Get Started