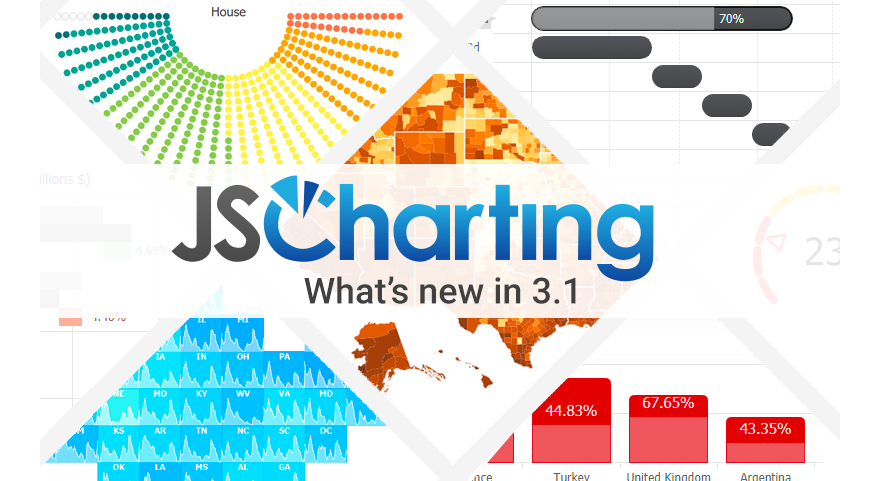
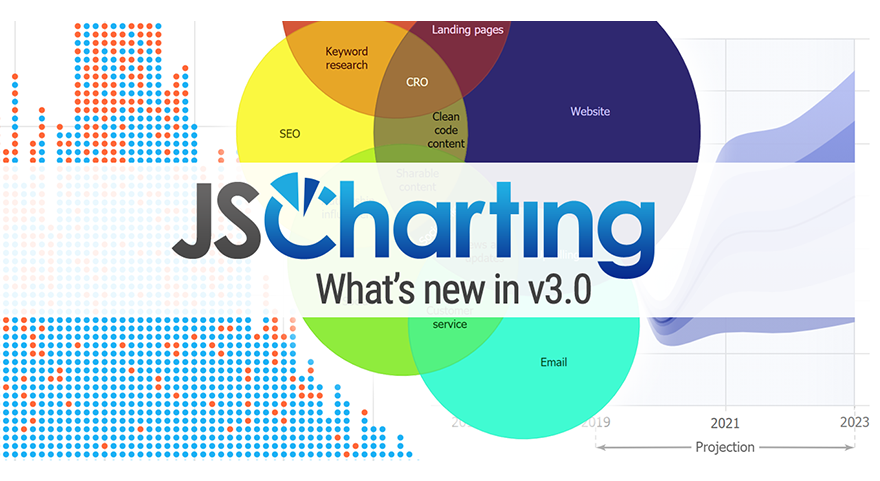
Version 3.2 includes advanced new features for numeric / string animation, label enhancements and more. Animation features include automatic number and string animation on UI changes, dynamic data and live updates. New label support automatically aligns to chart shapes and intelligent defaults cascade, saving time and additional lines of code. The JSCharting team has included many advanced examples demonstrating the new animation and label features which can you use as a base making your own high performance charts and dashboards quickly and easily.

Numeric Value Animation
In addition to seamless chart graphical animations, numeric values now support customizable value animation including incrementing numeric digits smoothly. This provides label constancy while bringing attention to real-time data updates in dashboard and KPI charts in particular.

Automatic String Tween Animation
When chart label text changes, the text will animate numbers and words within to indicate a change is taking place. You can use the label.animation property to control this animation independently other chart animations taking place.

Shape labels for pie, donut, and funnel types
These shape labels are now automatically aligned to the chart shapes. Multiple labels with different alignments can also be used with each shape. The automatic layout algorithm will ensure that labels don’t overlap when space allows it.

Default shape label property
Since many labels can be used for each shape, you may want to apply the same settings to each label. You can now use the shape.defaultLabel property to specify these settings once and have them apply to each label.

Automatic pie labeling
Charts with multiple pies and series that have names will automatically show shape labels for each pie.

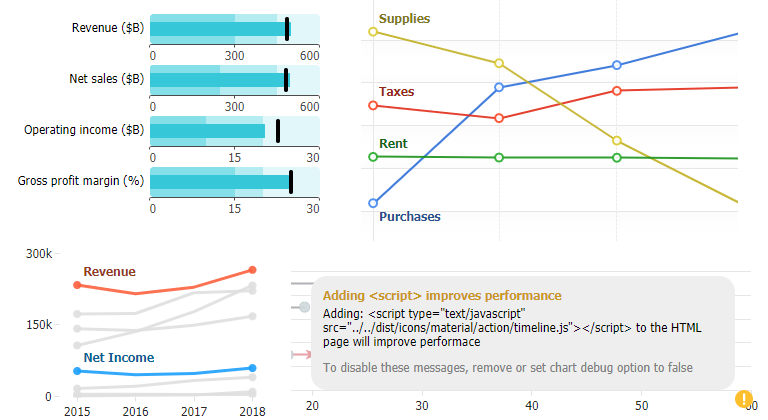
New Dynamic Samples
18 new samples including dynamic dashboards, animated values, animated strings, live data service consumption and much more. Plus hundreds of prior samples are updated to take advantage of the new animation system given a fresh modern look with important context to any charts with user interface interactions or data updates.