
User Interactions

JavaScript Chart Features

User Interactions

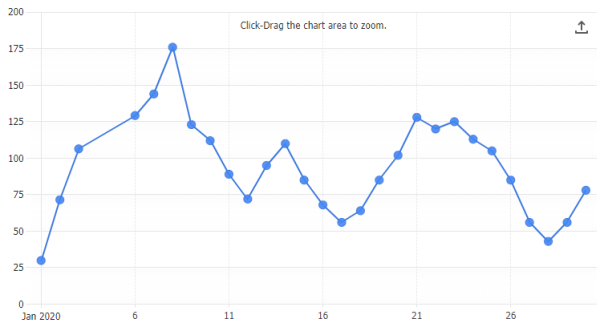
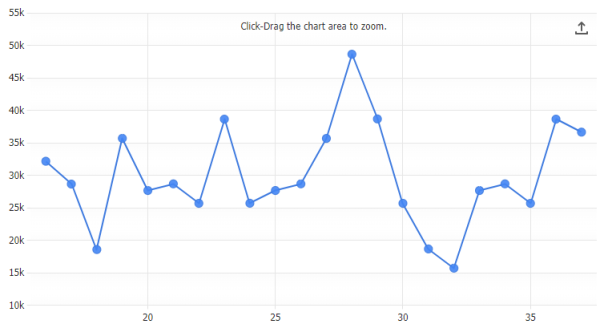
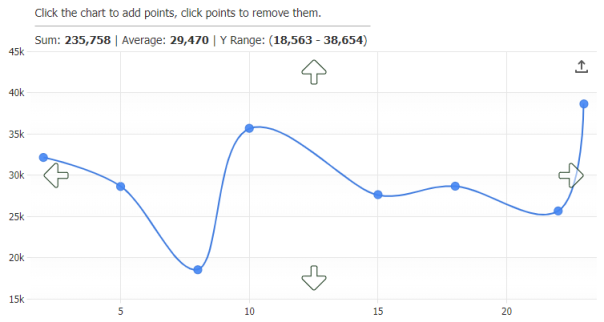
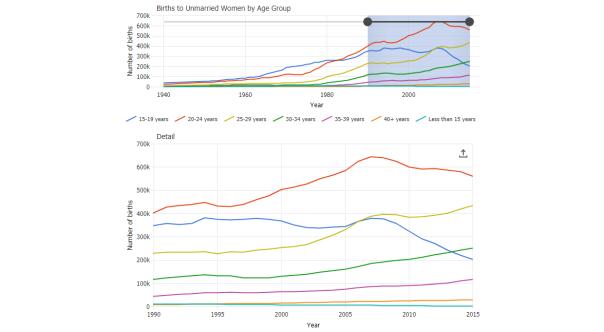
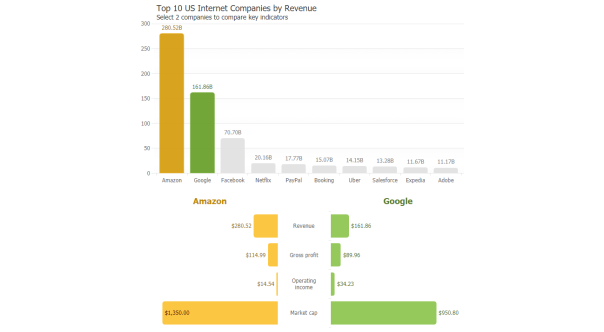
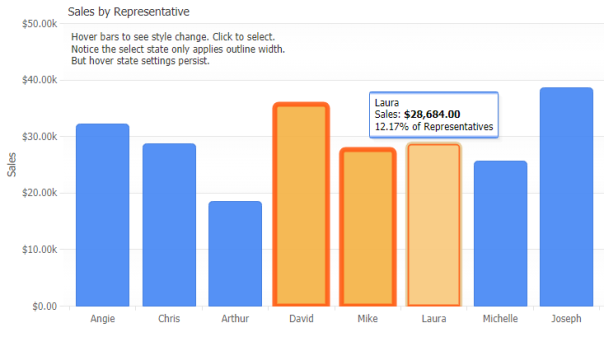
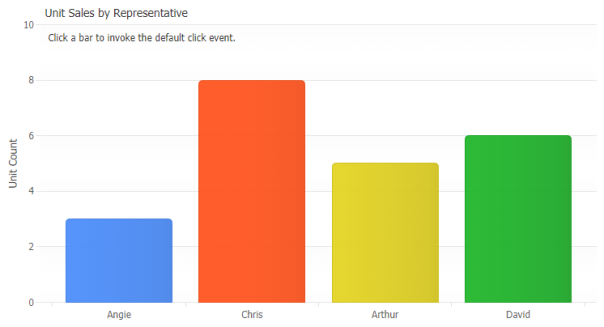
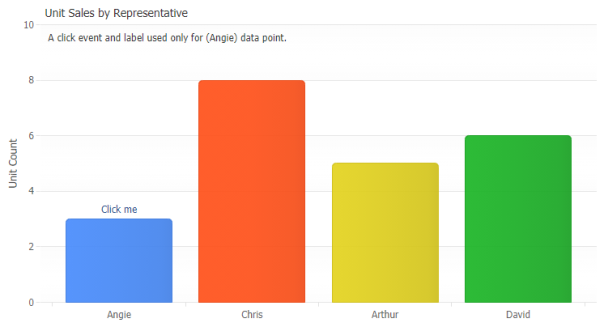
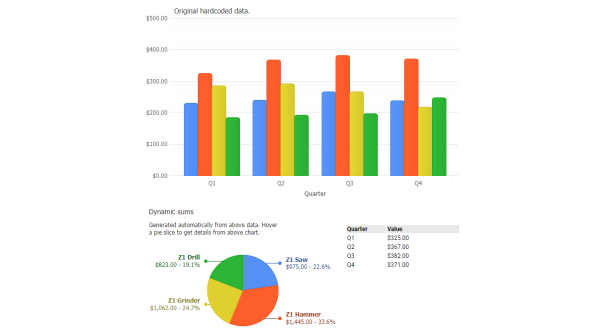
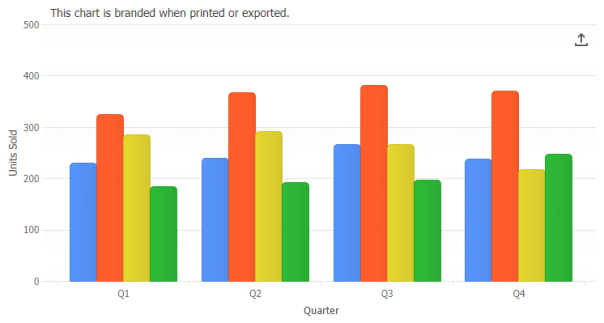
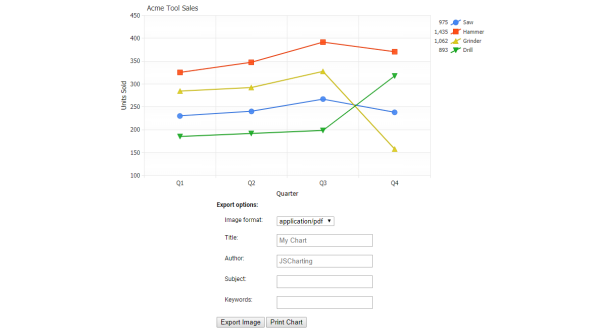
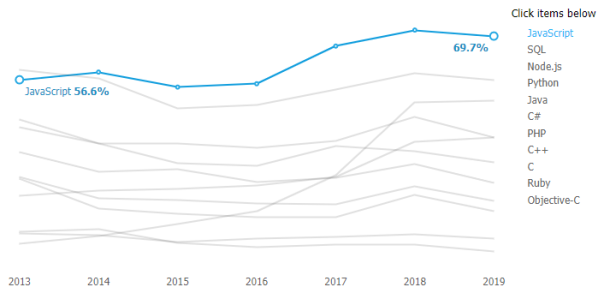
JSCharting supports robust interactivity, enabling page level settings to communicate with and modify the chart in real-time. Advanced interactivity features include dynamic legend entries, selection, URL targeting, drill-down and zooming. JSCharting's advanced interactivity can be utilized directly by end users through direct chart interaction as well as by the developer programmatically with JavaScript or page level interactions.

Axis Interactive Markers

Adds and removes axis markers dynamically through an interactive UI.

Edit
KPI buttons select details chart data.
Adjust pie shape elements using slider UI controls.
Slider UI controls with a visualization using markers.
Multiple map point selection master detail chart.
Slider UI item with a scale microchart.
Allows adding and removing data points interactively by clicking on the chart.
Master detail charts controlled with a slider UI item.
Limit point selection to a maximum of 2 points.
Point selection with checkboxes and a custom select or clear all checkbox.
Displays the axis values based on click location within a chartArea.
Get and set the axis range dynamically through an interactive UI.
Control a second detail chart by clicking on the master chart.
Use selecting events to draw a clipped overlay line series.
Column series type hover and select states.
Set a default point click event handler.
Set a point click event for the first data point.
Generates a chart based on data calculations from a different chart.
Adds a message to the chart seen only when it is exported.
Demonstrates how to export or print a chart programmatically.
Programmatically acquire multiple user selected data points.
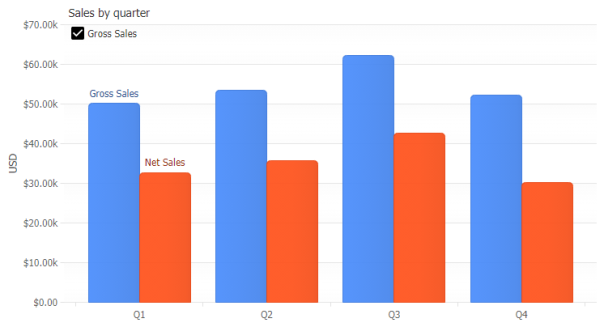
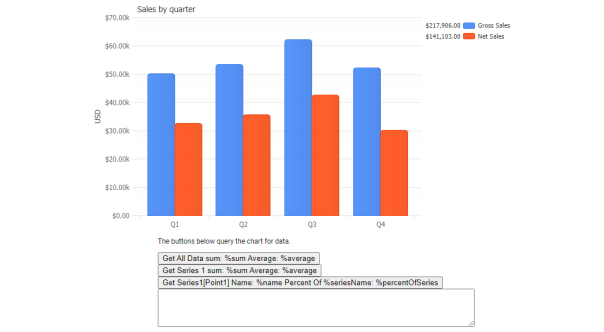
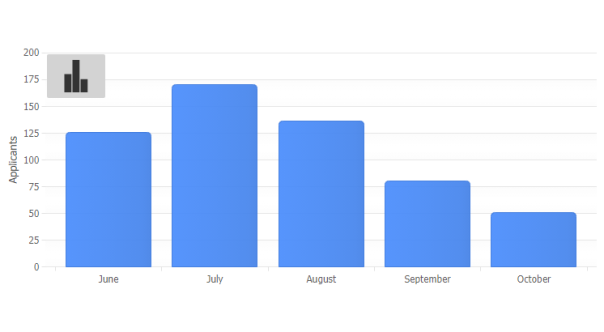
Uses the chart to replace tokens in an HTML string template used to show details in a table when hovering a point.
UI dropdown control with morphing SVG icons.
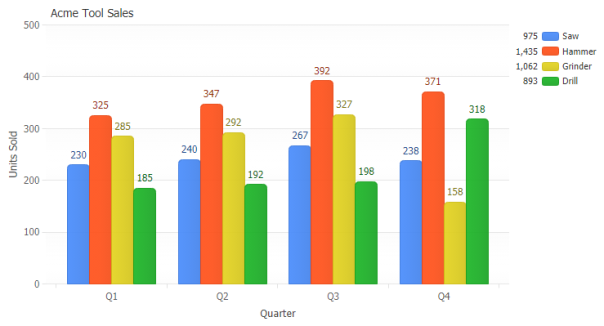
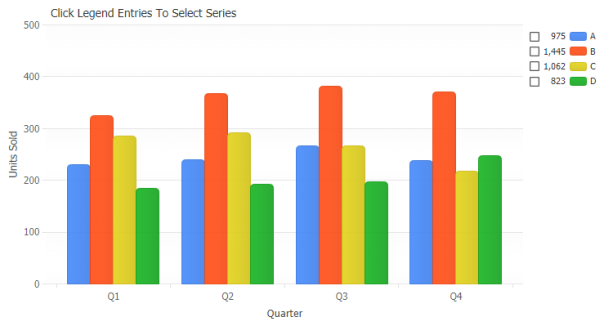
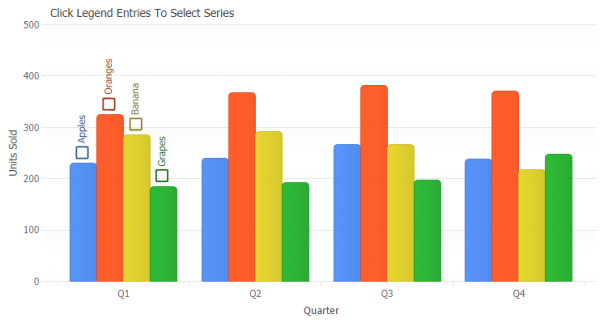
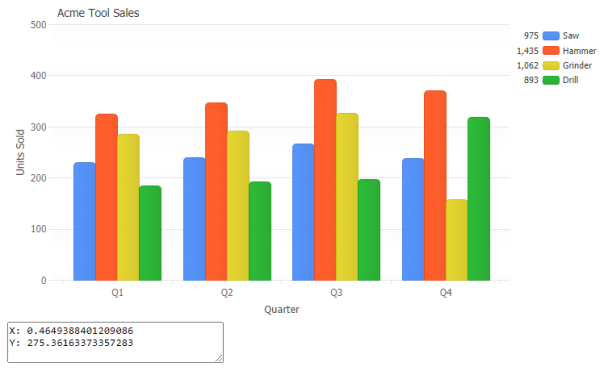
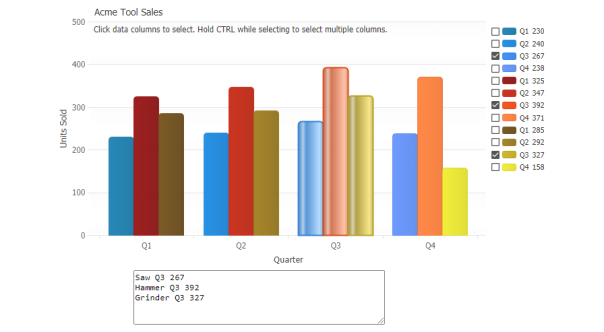
Demonstrates using series legend entry click events and how to suppress the default behavior.
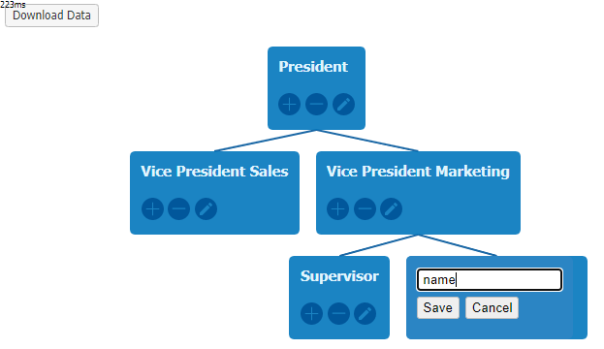
An interactive organizational chart designer with data download feature.
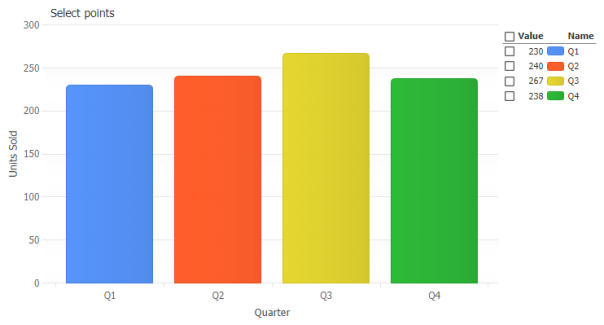
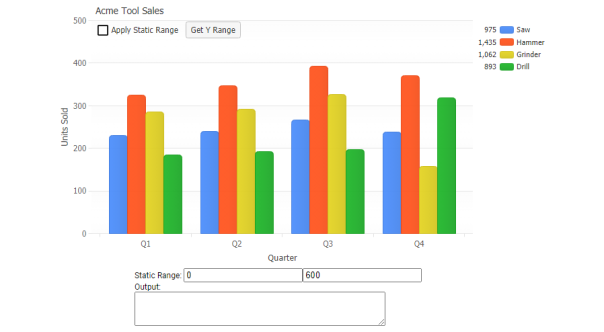
Uses select state to manually control series highlighting with legend entry clicks.
Modify legend entry click to select series with checkboxes.
Uses checkboxes on first points of series indicating series selection.
Demonstrates toggling series visibility using uiItem checkbox.
Queries the chart for info by passing a string with tokens to get relevant reports.
Demonstrates zooming a time series.
Demonstrates zooming the x axis.
Demonstrates zooming the x and y axes simultaneously.