Data Grid
JavaScript Chart Types
Data Grid
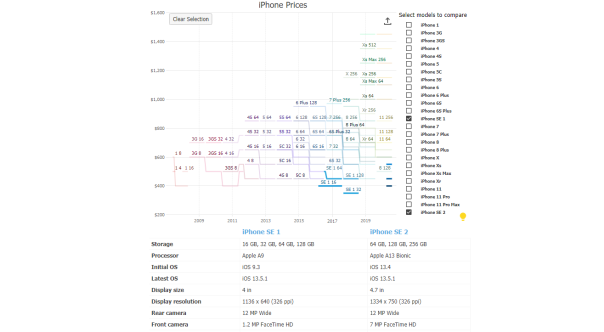
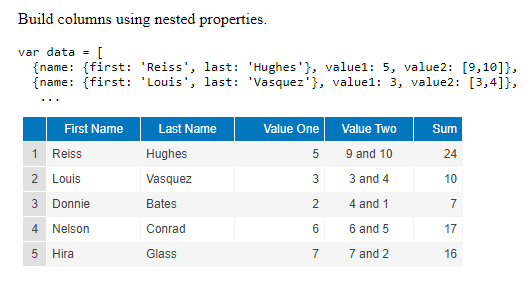
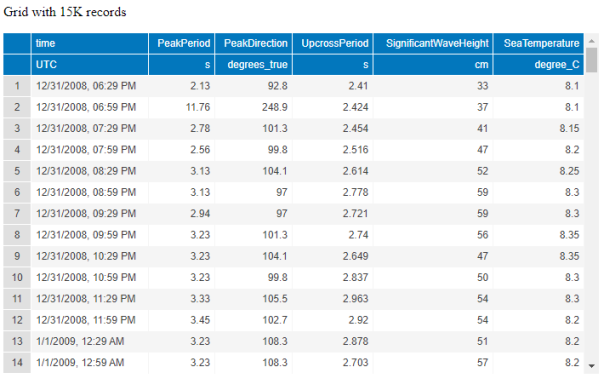
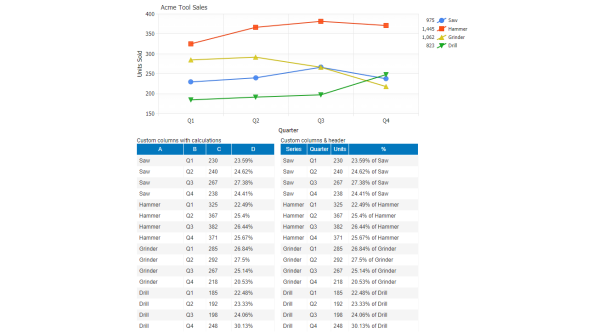
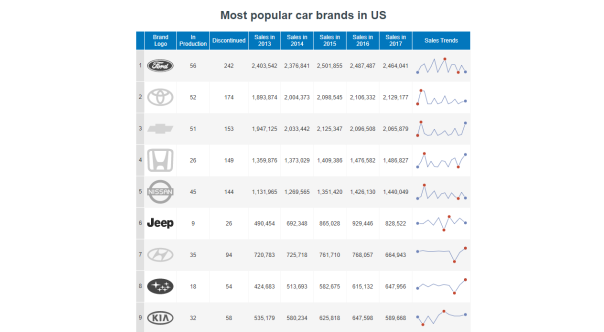
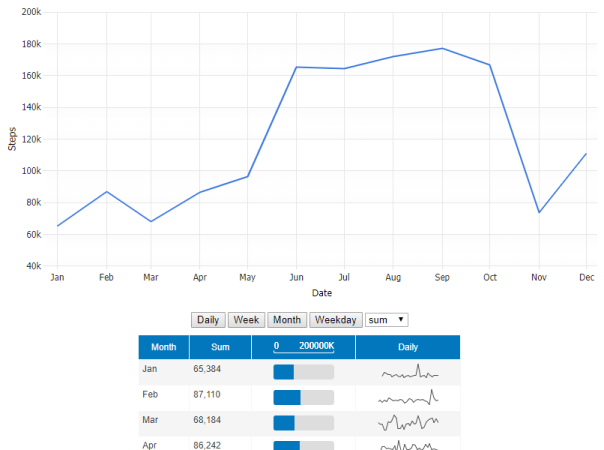
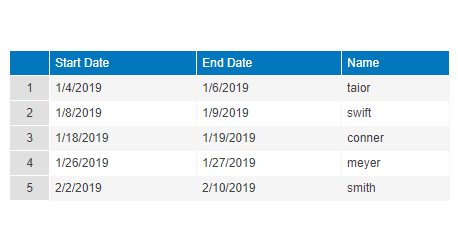
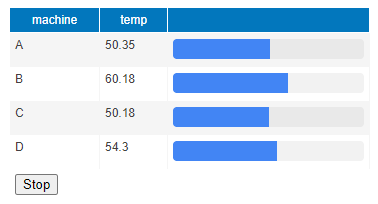
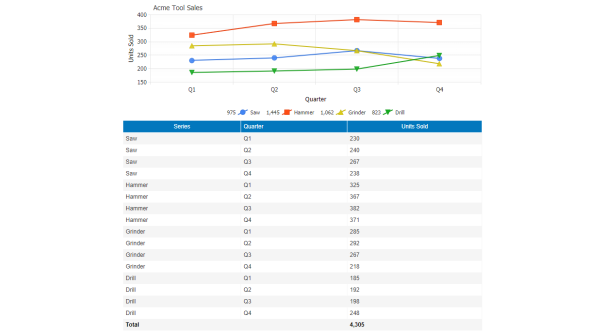
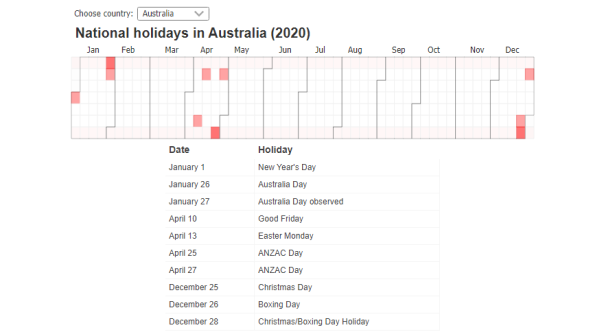
JSCharting supports JavaScript data grids that can consume JSON from any data source populated by chart data without the need for CSS or HTML. Chart data sets and remote data are seamlessly rendered with the built in grid component data-binding to the chart grid column with configurable column headers. Grid rows can also include SVG icons as well as micro charts and sparklines. The grid is fully client side, so no server side components are required. Load CSV, database or other data by AJAX and add your own custom styling easily. Large data sets handled automatically with pagination / paging displaying large data sets by loading on demand when scrolling. Work with any JavaScript frameworks including angular, vue, react, along with pure javascript and HTML5 explore the javascript grid library more through the open source samples included below.
See also Data Grid Tutorial