Dumbbell Charts
JavaScript Chart Types
Dumbbell Charts
A Dumbbell chart, also called a Dumbbell graph, is a data visualization for illustrating the difference between two groups of data or two data points. Dumbbell charts are also known as barbell charts, DNA charts, connected dot plots and gap charts.
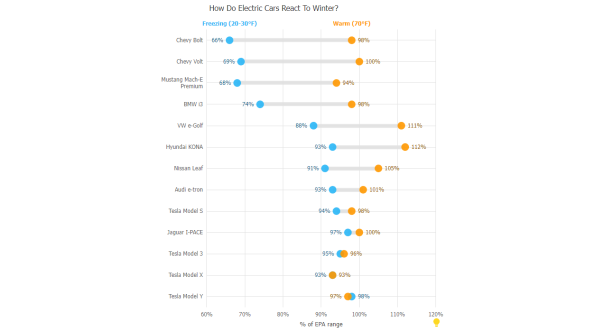
Dumbbell plot chart. Multiple line series with line caps to signify change over time.
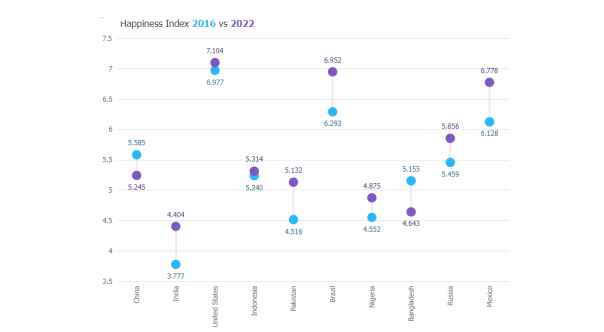
A dumbbell slider chart with offset markers to compare data between two years. Uses firstPoint and lastPoint to manage styling.
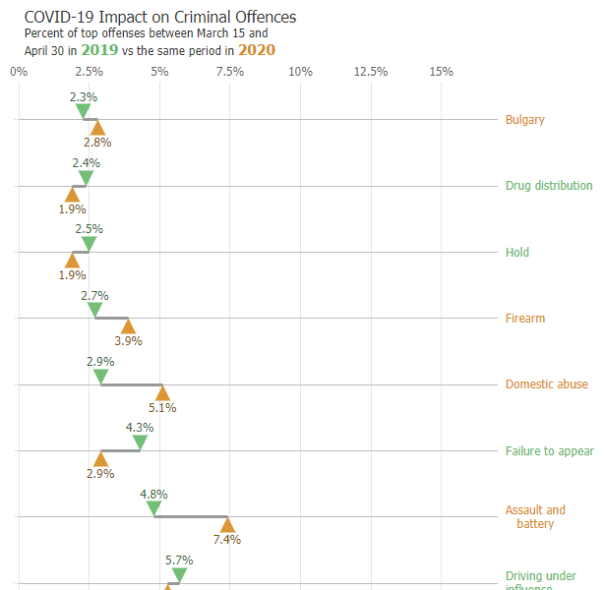
A dumbbell chart with multiple Y axes using first and last point Y axis ticks on the second (top) Y axis.
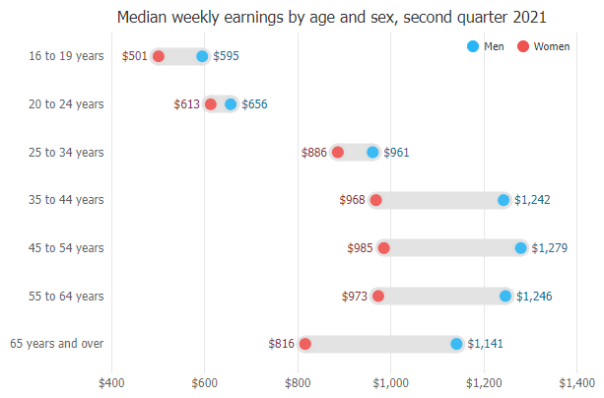
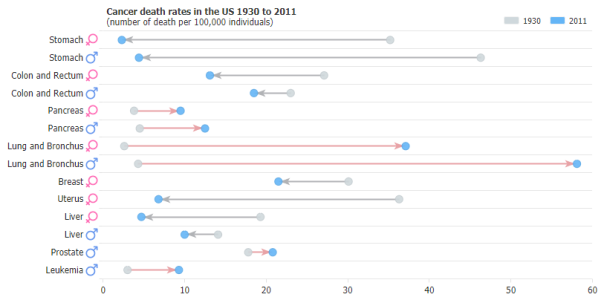
A dumbbell chart with capped line to compare data between men and women. Uses firstPoint and lastPoint to manage styling.