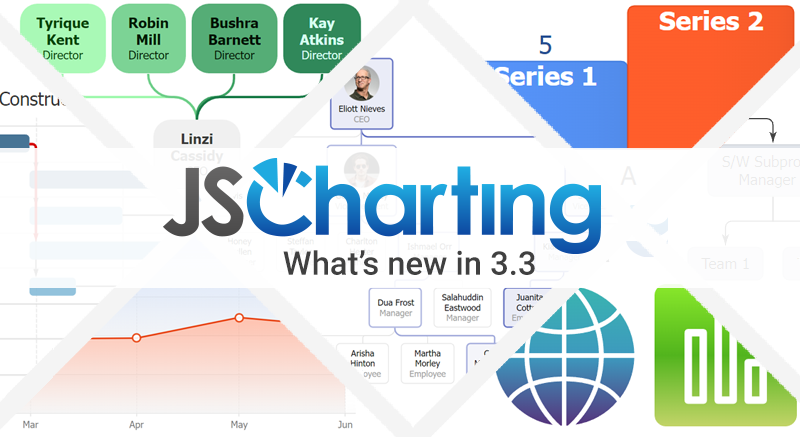
We are thrilled to announce an exciting new release for project management and data visualization - Gantt Charts by JSCharting as a standalone product!
Revolutionizing Project Management with Gantt Charts
For years, JSCharting has led the way in offering innovative solutions for data visualization. Today, we're excited to introduce a standalone version of our Gantt Charts, providing developers with a dedicated tool to streamline project timelines, enhance collaboration, and elevate the project management experience for managers and teams.Visit the JavaScript Gantt Chart Examples
What Sets Gantt Charts by JSCharting Apart?
- Seamless Integration: Whether you have used JSCharting for other chart types or are exploring it for the first time, the standalone Gantt Charts provides seamlessly integrates into your JavaScript projects, delivering a harmonious experience.
- Intuitive Design: Our Gantt Charts boast an intuitive and user-friendly API, making it easy for Developers to create, modify, and track project timelines with precision and clarity.
- Dynamic Interactivity: Experience dynamic interactivity with features such UI initiated critical paths, dependency management, partial task completion visualizations and more. Gantt Charts by JSCharting adapts to your project's changing needs, ensuring a responsive and agile workflow.
- Customization at Its Best: Tailor your Gantt Charts to suit your project's unique requirements. From color schemes to milestone markers, our Gantt Charts empower you to create visuals that resonate with your team and stakeholders.
- Enhanced Collaboration: Foster better collaboration among team members by providing a visual representation of project timelines, dependencies, and milestones. Gantt Charts by JSCharting transform complex project data into digestible and actionable insights all seamlessly visualized with resolution independent vector (SVG) graphics.

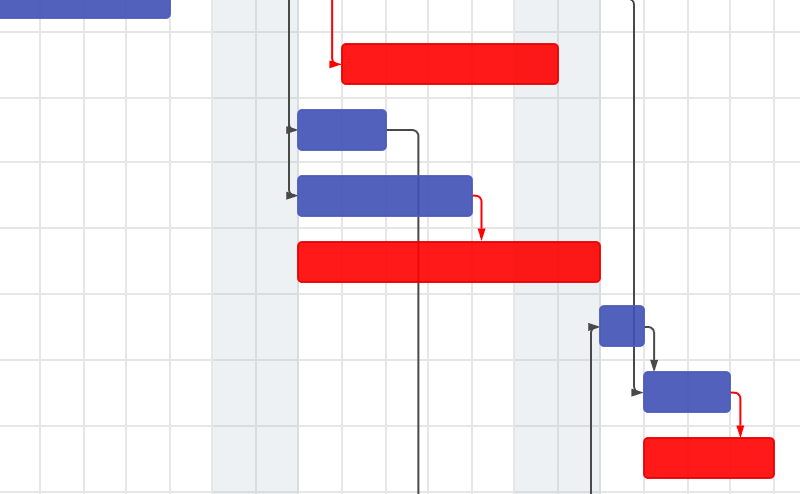
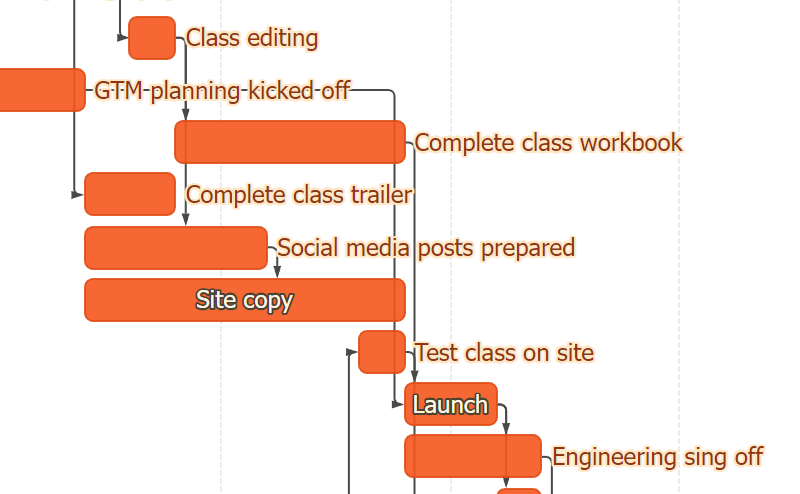
Gantt chart critical path support
New connector styling support for Gantt charts lets you customize and highlight a Gantt chart’s critical path.
New series and point defaultLeafPoint options
To help you work more efficiently with hierarchical charts, you can apply point options to only leaf points (points without any points below them in the hierarchy) or only apply options to leaf points that descend from a specific parent.
{
  defaultSeries: {
    defaultLeafPoint: {
      color: 'blue'
    }
  }
}
Dynamic label outline color
JSCharting improves legibility by intelligently selecting data point label colors that contrast with their background. When text overlaps areas such as connector lines, fills or gradients, you can use a text outline with an adjustment value color. This adjustment is based on the automatically selected label color.
defaultPoint_label:
{outline: {color: 'contrast'}}
Automatic Column Rounding
A major leap in aesthetics seamlessly maintained as your data changes, JSCharting will apply corner rounding to columns and bars at the appropriate edges automatically. No need to write code to avoid having notches between stacked items or any other problem scenarios. A visually pleasing corner radius is also automatically calculated to soften the column look regardless of size while being subtle enough not to interfere with reading specific chart values.
Getting Started:
- Navigate to the Downloads section and select Standalone JS Gantt.
- Follow the simple installation instructions in the documentation.
- Start creating breathtaking charts!
The Future of Project Management Unveiled
With the release of Gantt Charts as a standalone product, JSCharting is taking project management to new heights for partners whose needs are speciic to Gantt Charts alone. We believe that this dedicated tool will empower project managers, teams, and developers to visualize, plan, and execute projects with unprecedented efficiency and clarity. Join us on this exciting journey as we redefine the future of project management through the lens of Gantt Charts by JSCharting. Embrace the power of visualization and make your projects not just manageable but truly remarkable! Thank you for being a part of the JSCharting community. Here's to a future filled with successful projects and visually stunning Gantt Charts! Happy Charting!