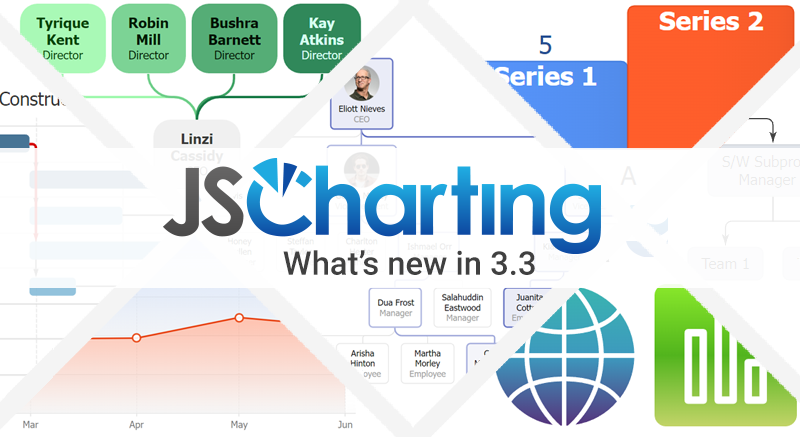
We are excited to announce a new development that will reshape organizational data visualization and planning – the launch of Standalone JS Org from JSCharting!
Empowering Your Data Visualization Journey
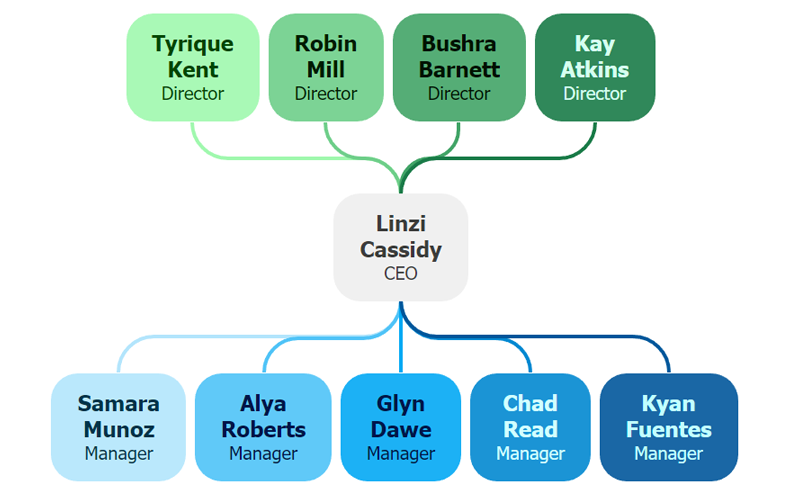
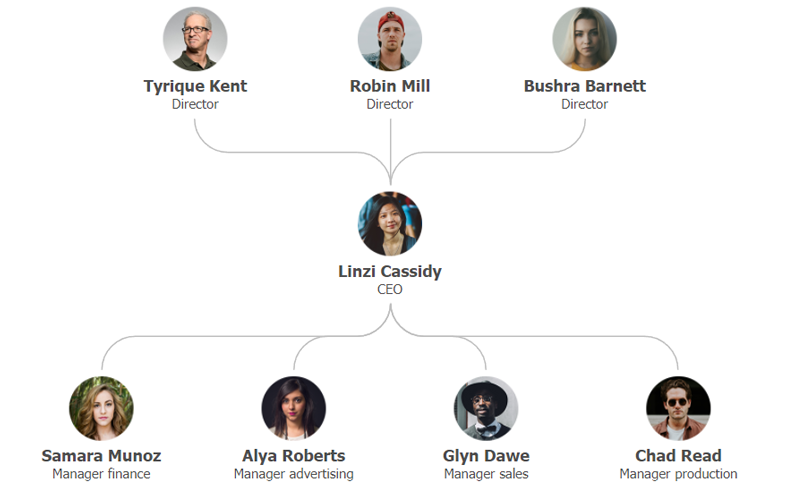
This latest offering opens up a world of possibilities for organizations seeking to effectively map out their structures, hierarchies, and relationships. With Standalone JS Org, users gain access to a comprehensive toolset tailored specifically for crafting intricate organizational charts with ease and precision. Whether it's visualizing reporting lines, departmental structures, or team compositions, this innovative solution empowers developers to create dynamic and insightful representations that enhance decision-making and strategic planning processes. Say goodbye to cumbersome charting methods – Standalone JS Org is here to streamline your organizational visualization needs and propel your data-driven initiatives to new heights! Visit the JavaScript Organizational Charts Examples
What's Standalone JS Org?
Standalone JS Org is a standalone version of JSCharting that allows you to harness the full power of our JavaScript Organizational charts quickly, efficiently and affordably. This means you can seamlessly integrate JavaScript Organizational Stand Alone into your projects without relying on external libraries or frameworks, giving you unprecedented control over your data visualization.
Key Features:
- Independence Matters: Enjoy the freedom to use JSCharting Org without being tied to specific frameworks. Whether you're working with React, Angular, Vue, or plain vanilla JavaScript, Standalone JS Org offers unparalleled flexibility.
- Lightning-Fast Performance: With no external dependencies, Standalone JS Org ensures lightning-fast performance, providing a smooth and responsive user experience for your applications.
- Effortless Integration: Easily integrate JSCharting into your existing projects or start a new one from scratch. Our comprehensive documentation and extensive examples make the integration process a breeze.
- Full Customization: Take customization to the next level with the freedom to tailor every aspect of your org charts. From colors and styles to interactive features, line and connector customization and much more, Standalone JS Org puts you in the driver's seat.
- Responsive Design: Create visually stunning charts that look great on any device. Standalone JS Org provides resolution independent vector graphics (SVG) that are sharp across all devices.
Organizational chart vertical leaf point layout
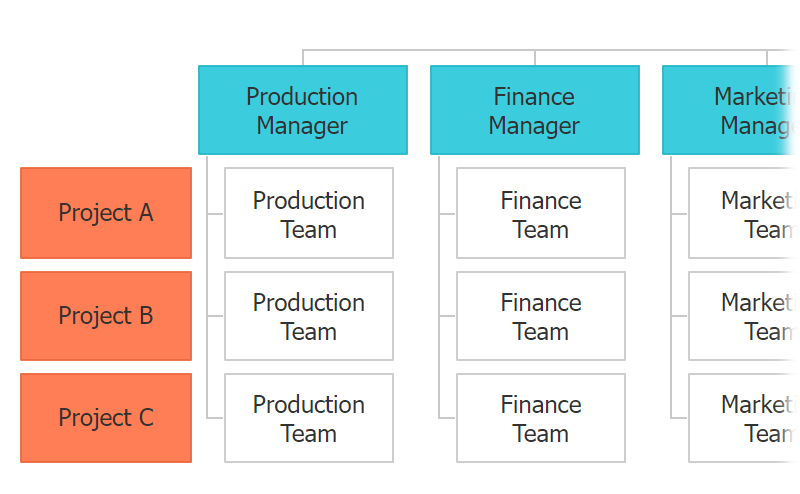
You can now optimize organizational chart layouts by stacking leaf points vertically. This can reduce the space required for the chart which is especially useful for larger organizational charts.
{
  defaultSeries: {
    leafPointLayout: 'vertical'
  }
}
Right-angle or straight organizational connector lines
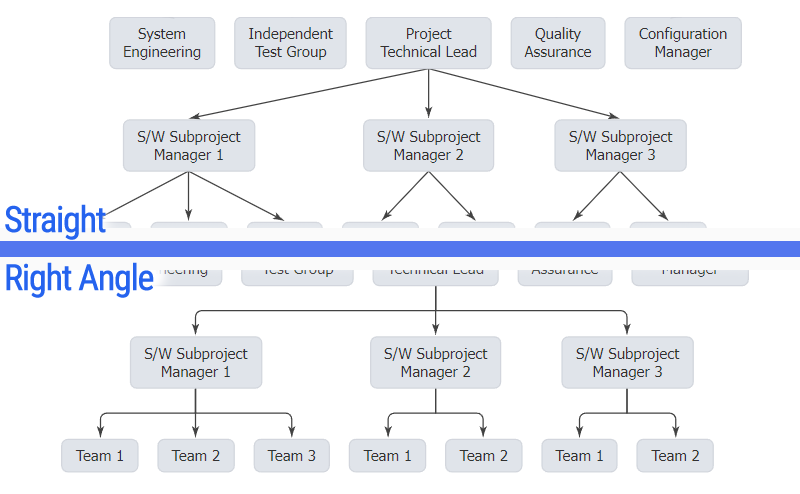
Right-angle or straight organizational connector lines
We enhanced how organizational connector lines appear by drawing them at right angles by default. You can use the straight option to change this default and draw connector lines directly between points.
type: 'organizational straight'Ability to set multiple parents and connector styles per data point
We enhanced the point.parent property to help you define multiple parents and connector line styling for each parent independently.
parent:[
{id: 'p1', line: {color: 'green'}},
{id: 'p2,p3', line: {color: 'red'}}
]
Point getParents() and getChildren() functions
Point getParents() and getChildren() functions
Need to manually traverse data points in an organizational chart? Now you can use the getParents() and getChildren() point functions to get collections of points immediately up or down the hierarchy tree.
chart.series()
.points(0)
.getChidren()
.each(p => console.log(p.name));
New point.connectorLine property

New point.connectorLine property
You can now specify organizational or Gantt chart connector line styling per data point, or as a default for all points.
defaultPoint_connectorLine:
{color: 'blue', width: 2}
Synchronize organizational node widths and heights

Synchronize organizational node widths and heights
We added point.annotation.syncWidth and syncHeight properties to help you control the sizing and visual balance of organizational chart nodes.
defaultPoint_annotation: {
// syncWidth: true == syncWidth_with: 'level'
syncWidth_with: 'level',
syncHeight_with: 'all'}
Getting Started:
- Navigate to the Downloads section and select Standalone JS Org.
- Follow the simple installation instructions in the documentation.
- Start creating breathtaking charts!
Join the Revolution in Data Visualization
Standalone JS Org for JSCharting gives you a lean tool to meet all your organizational charting and data visualization needs. Explore the possibilities, break free from limitations, and elevate your data visualization game with Standalone JS Org. Join us on this exciting journey towards creating visually stunning and insightful organizational charts that make an impact. Thank you for being a part of the JSCharting community. Together, let's chart a future of limitless possibilities!