Axis Tutorials
Axis related features overview
Introduction
Chart axes are one of the most important and powerful elements of a chart. They affect many aspects from describing data to indicating how data points are arranged. Figure 1 below illustrates some common naming for different axis parts.
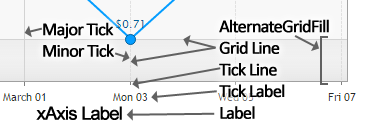 Figure 1.
The common X, Y and Z axis naming is often used but the roles they play can differ depending on the chart type. A more consistent and not chart type dependent designations for axes are:
- Value
Commonly referred to as the Y Axis, it is associated with the data y value. - Position
Commonly referred to as the X Axis, it is associated with the x value, and name properties. - Tertiary
Commonly referred to as the Z Axis, it is associated with the z property.
This naming is more consistent because If the chart type is 'horizontal' then the Y axis would refer to x data values instead of y values. We will use this naming in this tutorial.
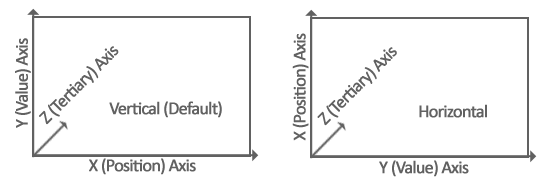 Figure 2.
One goal of the chart type setting is to allow changing the type from vertical to horizontal without changing any other code and render the chart correctly. For that reason, a horizontal chart type applies the xAxis options to the physical Y axis.
Axes and Chart Types
Axis scale settings can be used to specify how series behave. For example, a stacked scale makes series such as bars render as one bar made of all bars that share the same name or x value.
Bars are stacked on the position axis by default. This basically means they are drawn side by side. Setting the value axis scale to stacked, arranges the bars vertically stacked based on their value. If the tertiary axis scale type is set to stacked, they are arranged one in front of the other. This is useful for cases such as gantt.
Axes Describe Data
These axes are a visual reference, but because they are associated with specific point value properties, they also describe those values. For example, a Y (value) axis that shows cost in USD ($) also implies the point y values represent cost in USD.
Consider data like greg: 5, martin: 8. if these values describe currency, it is safe to say that the Y axis describes currency.
Axes are used to define formatting and a descriptive string label (axis.label.text) that appear on the axes if shown and used in automatic tooltips.
Bubble series include X, y values and the z value represents the bubble size. The following code can be used to create the automatic tooltip label shown in figure 3.
{
  xAxis_label_text: "Life Expectancy",
  yAxis_label_text: "Fertility Rate",
  zAxis_label_text: "Population"
}
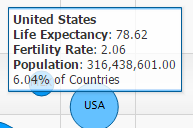 Figure 3.
Tokens such as %yAxisLabel can be used in point labels and other point or series related strings to automatically use the specified axis descriptions.
Axis Styling Features
Axis Line Breaks
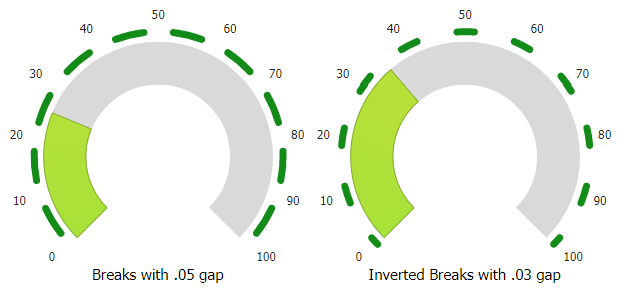 Figure 4.
Axis lines include a feature that can break the line into segments at tick positions when the axis line.breaks property is defined:
{
  yAxis_line_breaks: {}
}
Gap sizes can be adjusted and the gap and line fill sections can be reversed using the line breaks option.
{
  yAxis_line_breaks: {
    gap: 0.2,
    invert: true
  }
}
Axis Line SmartPalette
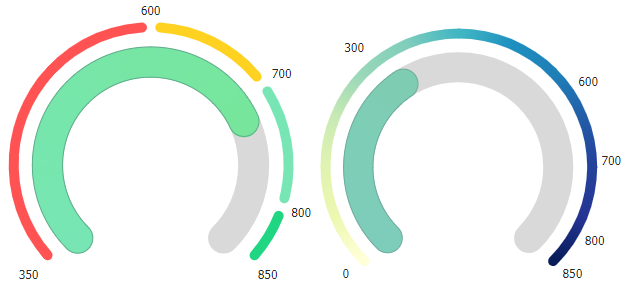 Figure 5.
The axis line can also be colorized by using a smartPalette. If the smartPalette is defined at the chart.palette level, the axis colors can be applied to the axis with the following code snippet:
{
  yAxis_line_color: "smartPalette"
}
If the palette is defined at the series level and includes an id, the palette can be specified with code such as:
{
  yAxis_line_color: "smartPalette:id"
}
| Page | Description |
|---|---|
| Axis Scales | Axis ranges, scales, and related details. |
| Axis Ticks and Markers | Defining custom axis ticks and markers. |
| Axis Range Ticks | Using axis range labels (ticks). |
| Multiple Axes | Multiple axes can serve many uses on charts. The most common is having each series use its own axis because the values between series vary too much to share one scale. |