Bundle Overview
A quick overview of the most common tasks related to creating charts.
Overview
The bundle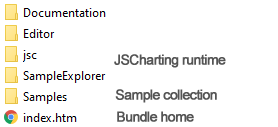 | JSC Javascript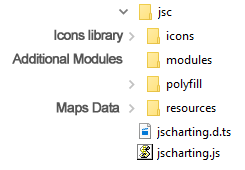 |
The JSC folder contains all the resources necessary to generate charts using JSCharting. | |
Exploring installed content
- Sample Explorer - This tool provides a quick way to search and browse samples matching your criteria. You can also navigate the sample browser broken down by specific tasks. Please see the Exploring Samples Tutorial for more information. By default, samples that are supported in the editor will open in that view, otherwise, the sample file will be directly opened. All samples are available in the /Samples folder as HTML files you can view or edit directly as you wish.
- Documentation - The JSCharting documentation provides a collection of tutorials along with a complete API reference. The API reference is split into 2 sections: Config and JS Objects.
- The Config Objects section defines JS configuration objects used to specify settings for the chart, as well as pre-defined string settings under the Enums node. Please note that the Chart node under Config Objects is type similar to those listed under the Types node, and is simply a link to provide quicker access to this most commonly used configuration.
- The JS Objects section defines the direct API for the JSCharting library. The JSC object can be used to create a chart, while the remaining objects are returned by methods and are not instantiated directly. The JSC.Chart() method constructs a chart JS Object and is the primary way to generate a chart. It takes a Chart configuration to define the chart's settings.
API Documentation
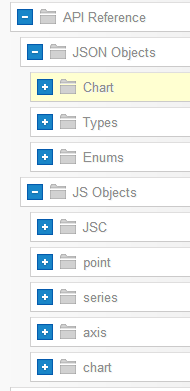 | The Config Objects node contains definitions for configuration objects that are used to define chart settings and data. There are many types of configurations, and they are listed under Config Objects.Types. The Enums section contains predefined string settings that are used by some configuration properties. The JS Objects node describes JS objects provided with the library. The main JS object is JSC. It provides a method that constructs a chart as well as some utility methods. All other types listed there are not constructed manually but returned by the chart object itself. API Color Coding
|
PHP Database samples
If the sample explorer is running on a server that supports PHP, samples using PHP and a database will be visible. Otherwise, these samples can be found in the bundle/samples/php folder.
See PHP Data Engine Tutorial for more information on PHP features.
Editor
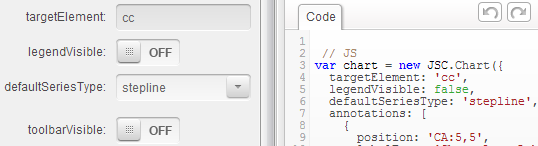 |
| The JSC Editor provides editing and design time capabilities which automatically create UI controls for all the chart settings in the given sample code. The generated UI includes available options as well as real-time documentation of those settings. Chart code can be copied into the editor to quickly modify settings such as colors and see the result of these changes in real-time. After editing, the code within the editor must be copied back into the HTML editor or IDE of your choice. |
Learning JSCharting
There are two main ways to learn how to develop charts using JSCharting. One is to read the relevant tutorials and API documentation to get a good understanding of the products functionality and capabilities. The other way is to find samples that demonstrate features specific to your requirements and use similar code. A mix of these approaches is ideal, but finding related samples to your needs will get you up and running faster. The JSC SampleExplorer is designed to make finding samples much more efficient. Please see the Exploring Samples Tutorial for more information. Once you have found a sample, you can quickly prototype and customize the settings using the JSCharting Editor.
| Page | Description |
|---|---|
| Exploring Samples | Using Sample Explorer to find samples for needed features. |
| Chart Editor | The editor provides an advanced design time environment for exploring and configuring chart settings to get the exact results for your specific needs and to further tune chart settings and visuals. It is also a great tool for learning JSCharting by exploring and interacting with the various settings and immediately seeing the result of your updates. The editor is broken into different windows, or panes, with specific functionality. |